July 2025 Release Notes

All optimizations at a glance - Important note

With this update, we would like to inform you about numerous new functions and optimizations in your aiomatic dashboard.

The new features provide you with a better overview, greater efficiency and even more targeted analysis options in your daily work.

As this is a comprehensive update, you will receive an individual introduction from your contact partner at your next regular appointment.

This will ensure that you can use all the new functions in a targeted manner.

The following is an overview of the most important changes in advance.

If you have any questions or comments, we are happy to discuss them in the next call with you!
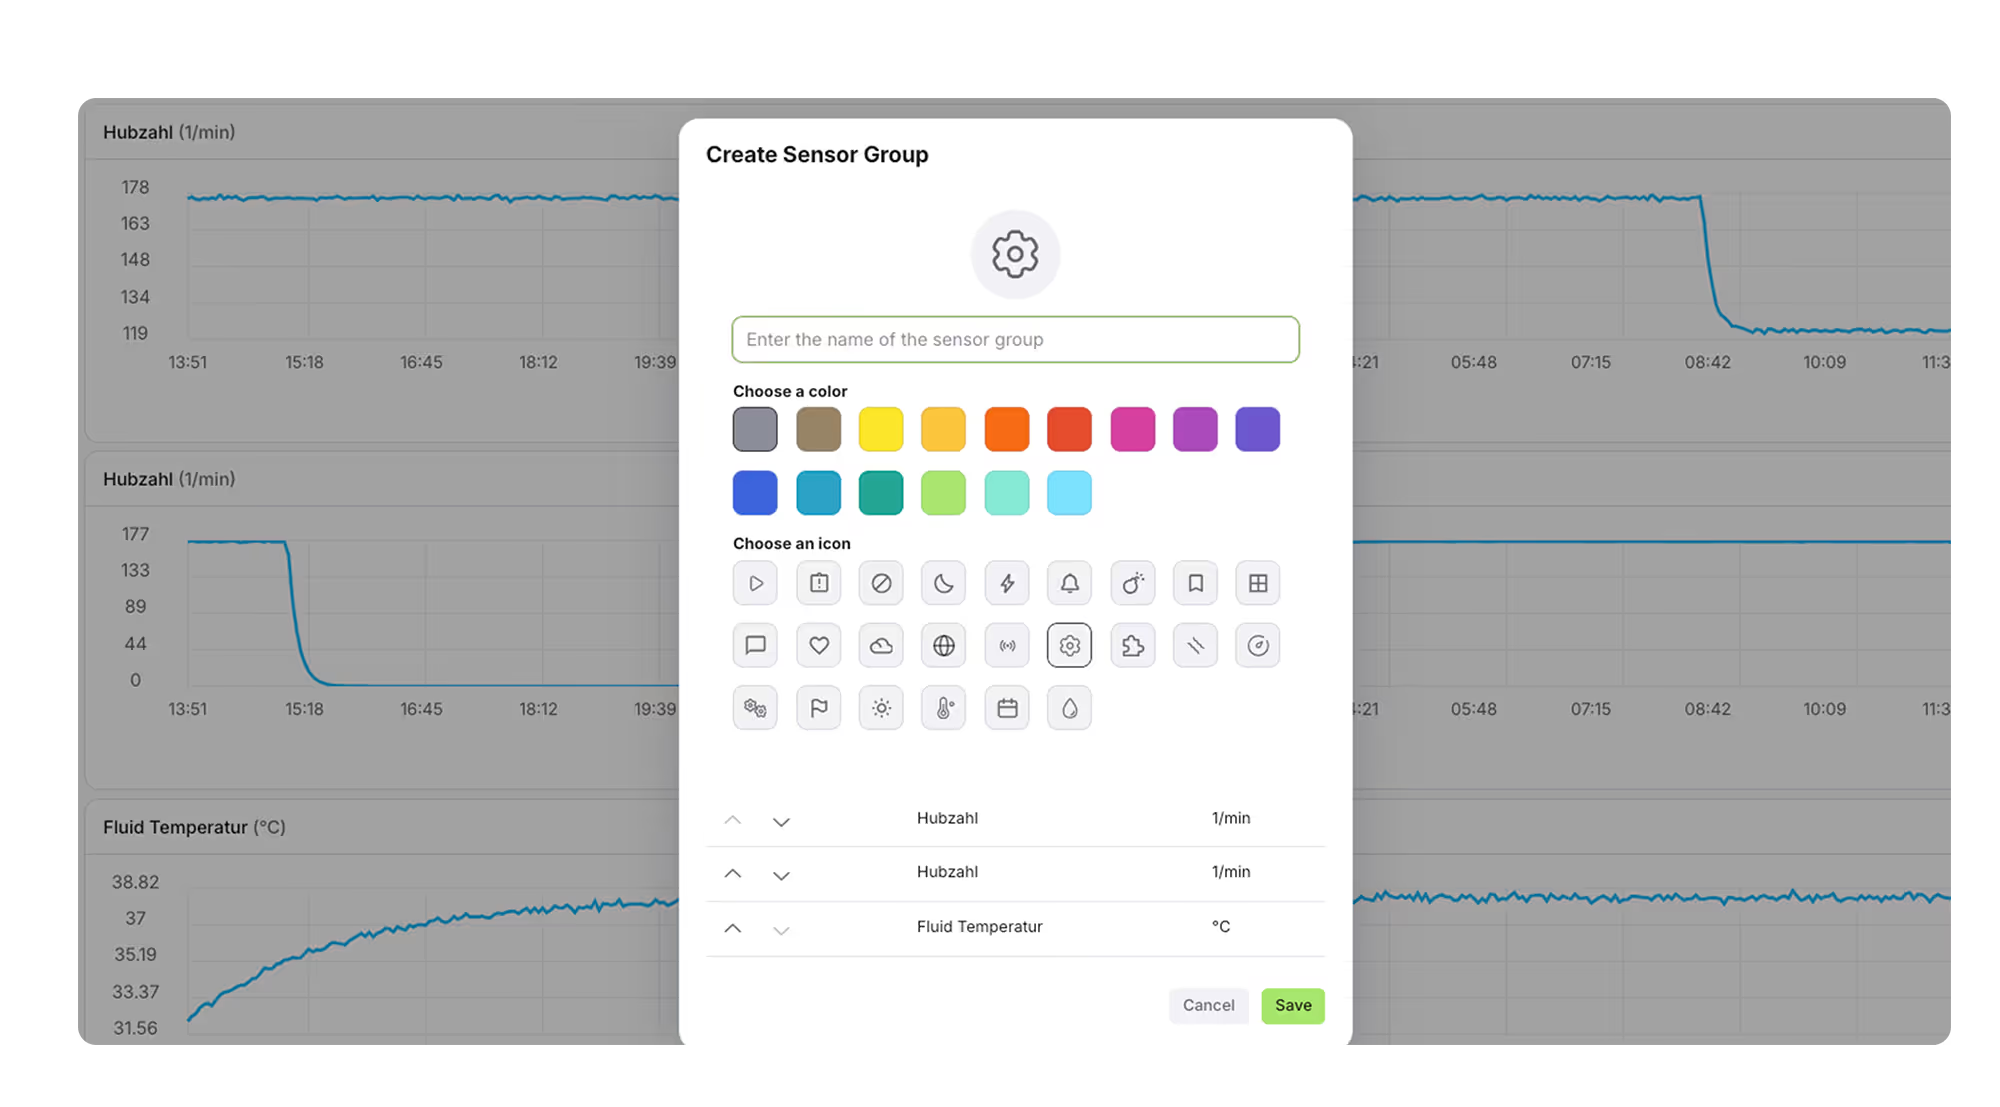
Storage of user-defined sensor groups
Logbook: creation of event templates
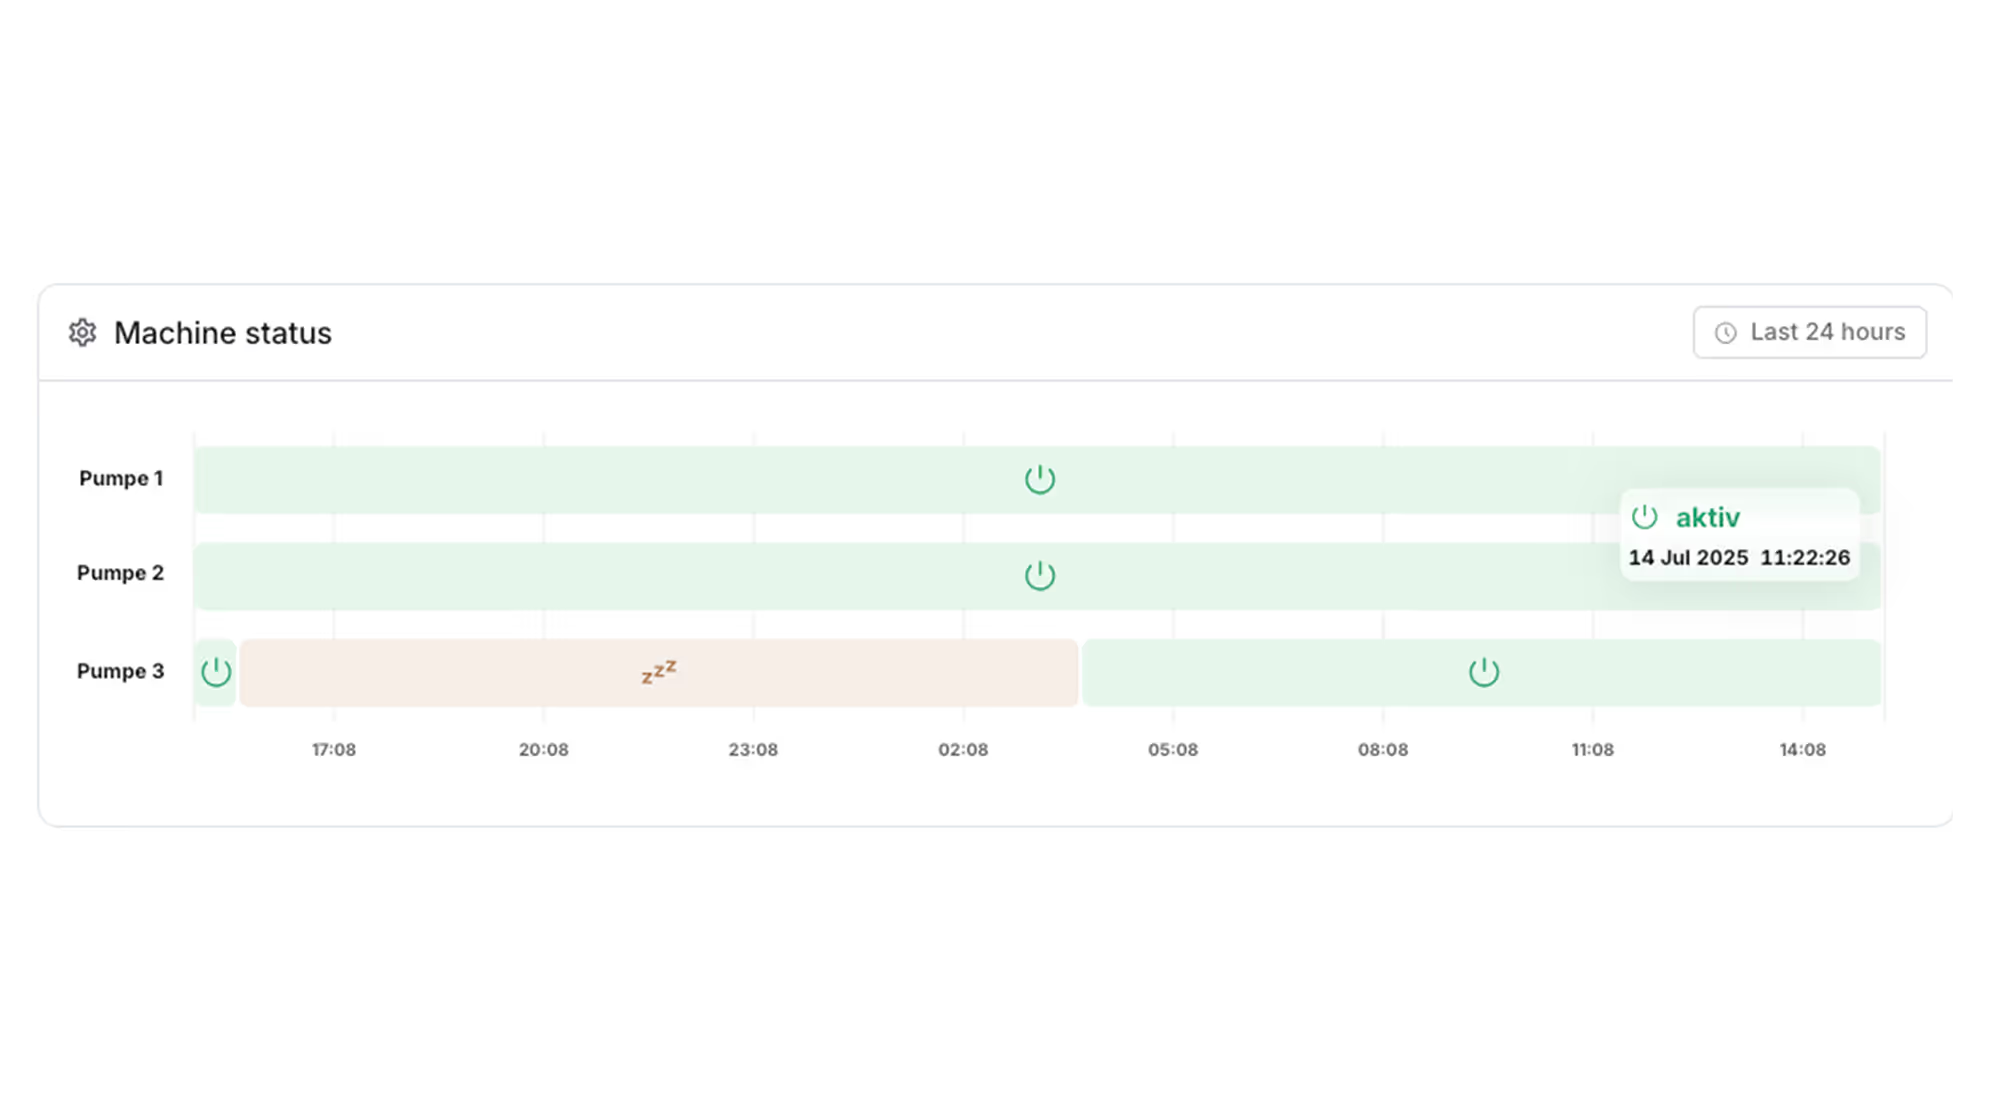
New overview of your machine's operating status
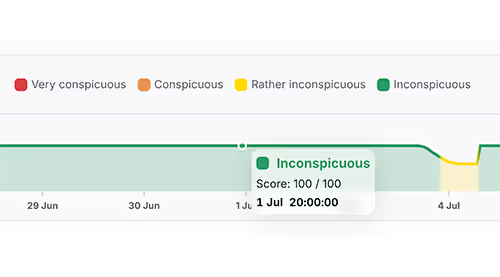
New Anomaly Index with segments
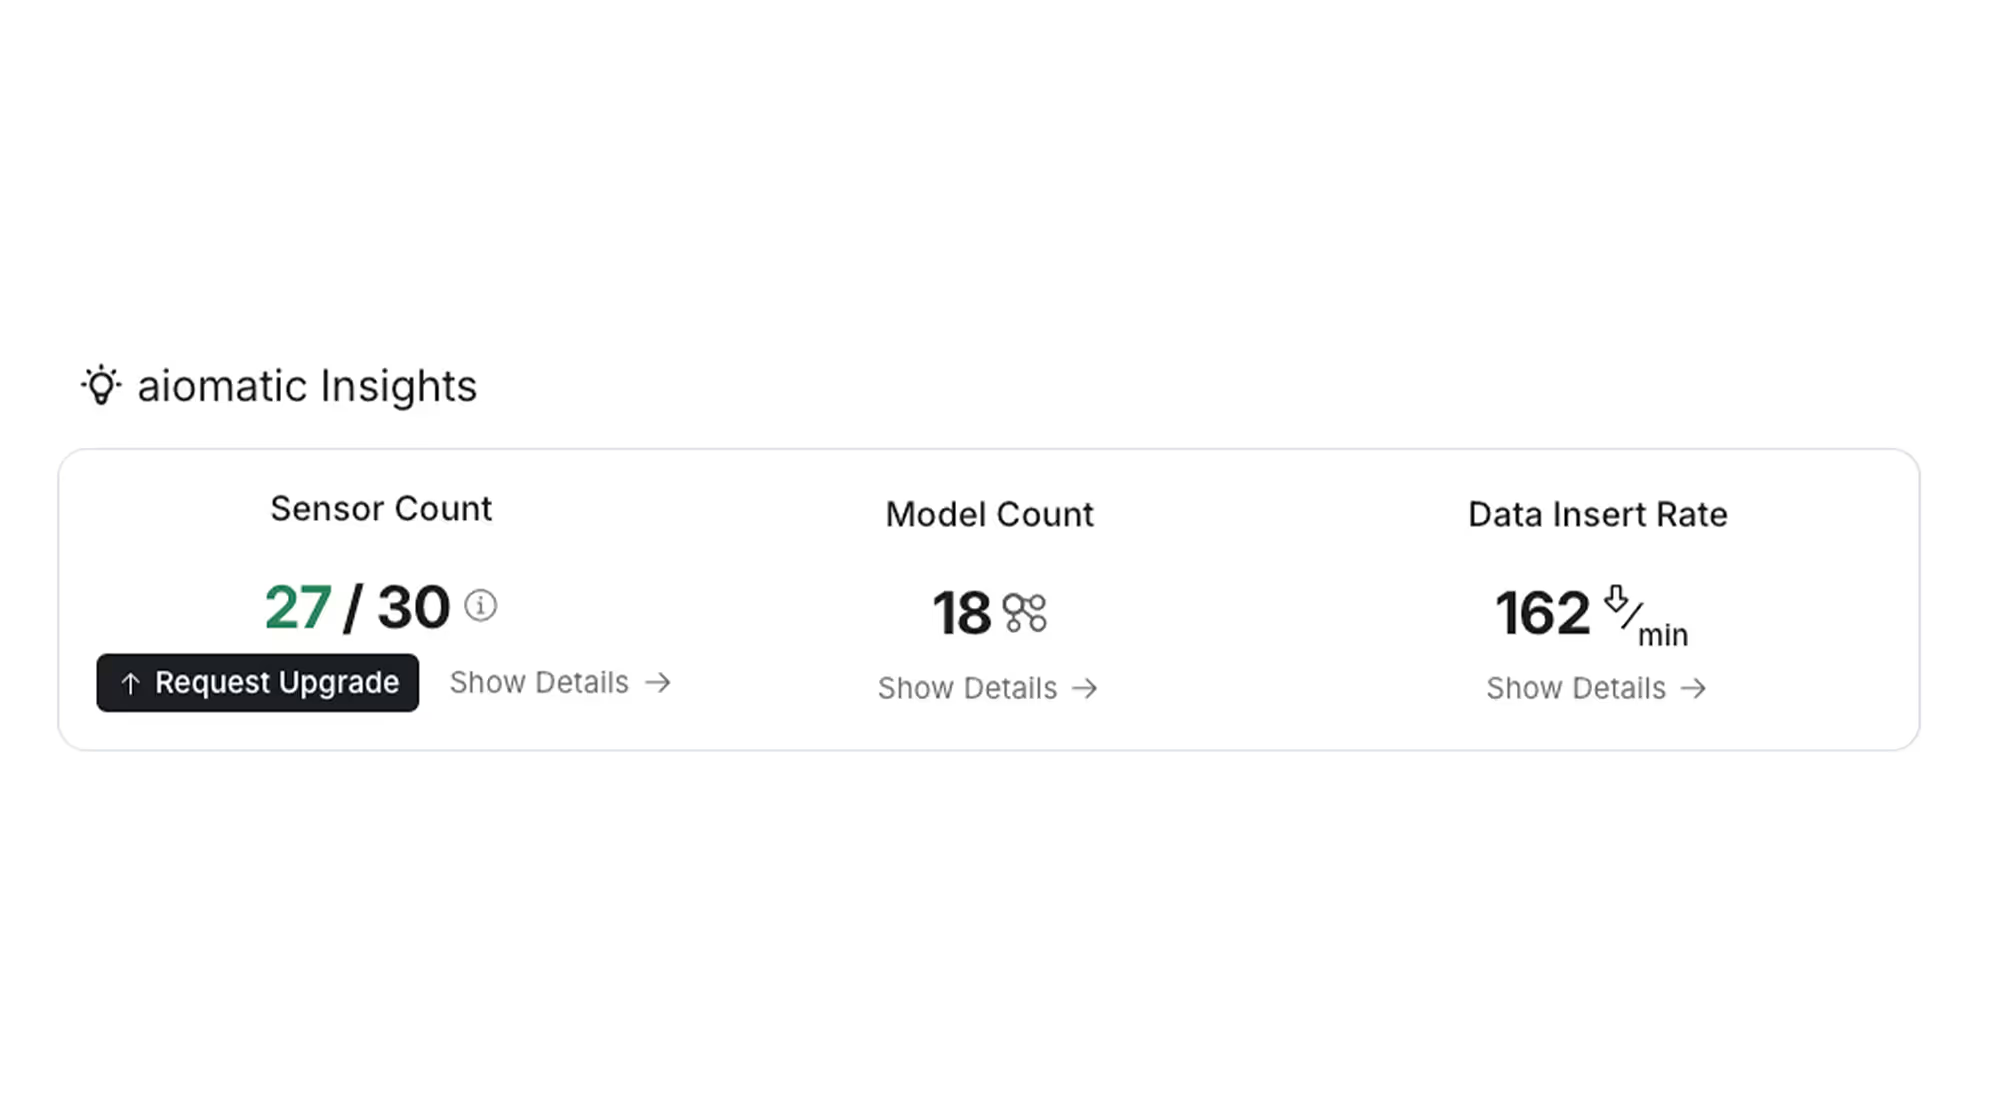
aiomatic insights: Your internal machine metrics at a glance
Overview of anomalies
Revised tooltip

1. Storage of user-defined sensor groups

What has changed?
Sensor groups can now be created and saved individually.
Multiple sensors can be grouped together and compared directly – without having to configure the view each time.
Benefits for you:
With just one click, you can now access saved sensor groups – e.g., all vibration sensors of a gearbox.
This saves time, improves clarity, and simplifies your analysis.

2. Logbook: creation of event templates

What has changed?
Templates for events can now be created in the logbook. For recurring events, it is no longer necessary to fill out the entire form each time - instead, for example the event type is already predefined.
Benefits for you:
The new function makes analysis easier and saves time.

3. New overview of your machine's operating status

What has changed?
Instead of the colored background in the plot, the operating status is now displayed as a separate bar chart. A tooltip has also been integrated - detailed information on the operating status of your machine appears when hovering the mouse over it.
Benefits for you:
The new display ensures greater clarity and better readability of the operating statuses.

Thanks to the tooltip, you can obtain further information without leaving the context - for an even more precise analysis.

4. New anomaly index with segments

What has changed?
The previous "Health Score" has been replaced by the new Anomaly index. Instead of a specific percentage, comprehensible categories such as “very conspicuous”, ‘conspicuous’ or “inconspicuous” are now used.
These categories are also visualized in color, which makes interpretation easier at a glance.
Benefits for you:
Clearer and more intuitive assessment of machine condition. Color segmentation enables faster detection of anomalies - for easier, visually supported assessment of potential anomalies.

5. aiomatic insights: Your internal machine metrics at a glance

What has changed?
With aiomatic Insights, we are presenting internal metrics transparently in the dashboard for the first time. These key figures were previously only used in the background and are now visible to users.
Benefits for you:
You always have an overview of your connected hardware and can quickly access the relevant information with just one click - for efficient and time-saving operation.

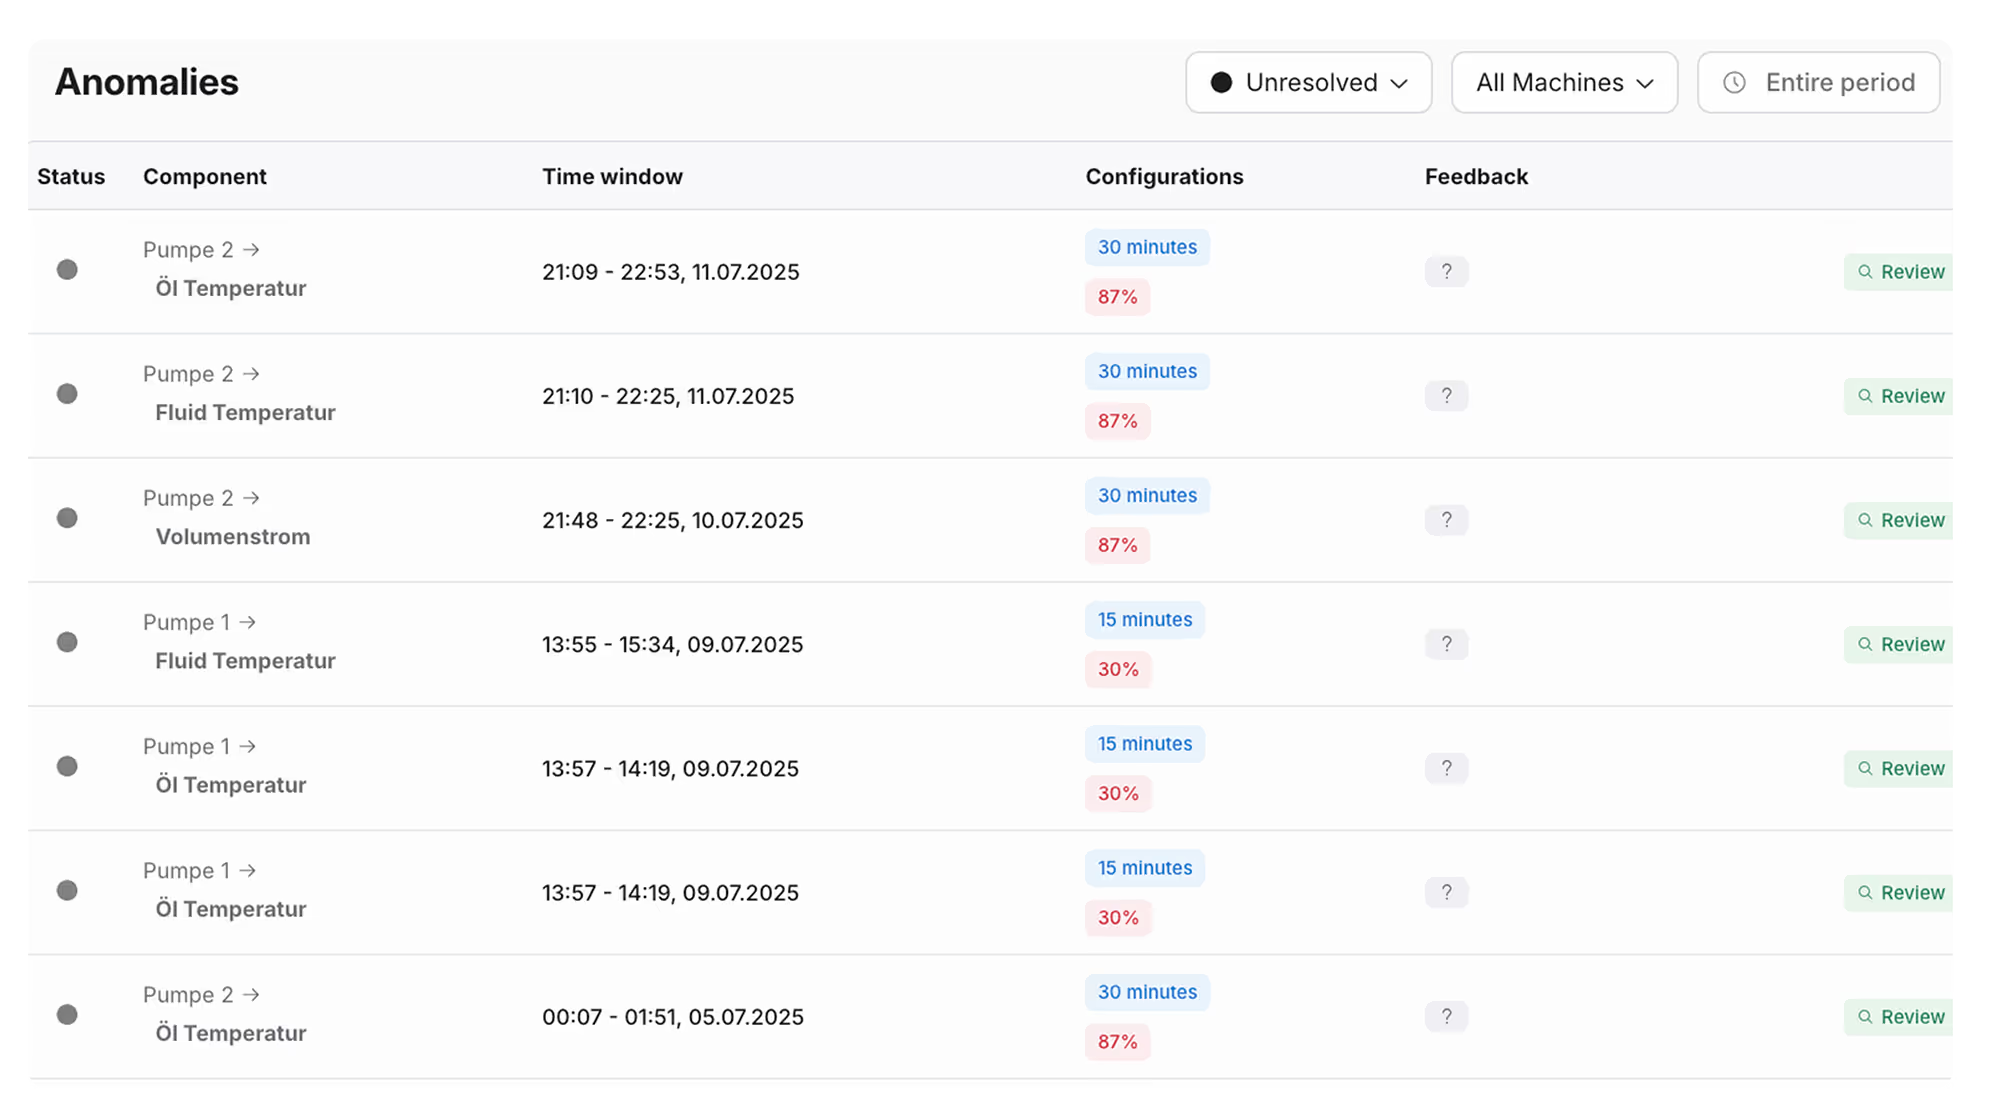
6. Overview of anomalies

What has changed?
There is a new list that shows all anomalies.
All anomalies can now be filtered by time period, machine or machine component, model and “seen” or “not seen”.
Benefits for you:
You receive a targeted and flexible overview of anomalies, can quickly find relevant cases and maintain an overview - for even more efficient error analysis and prioritization.

7. Revised tooltip

What has changed?
Tooltip, which displays additional information when hovering over a plot with the mouse, has been visually revised and improved.
Benefits for you:
The new design improves the readability of additional information, allowing you to recognize important details more quickly and conveniently.

Our new dashboard at a glance

Thank you We have received your message and will get back to you as soon as possible!
Unfortunately that didn't work! Please check that all mandatory fields have been filled out!